Transform raw event check-ins into actionable intelligence. Monitor live arrival velocity, room occupancy heatmaps, session dwell times, and sponsor booth footfall with sub-second real-time dashboards.
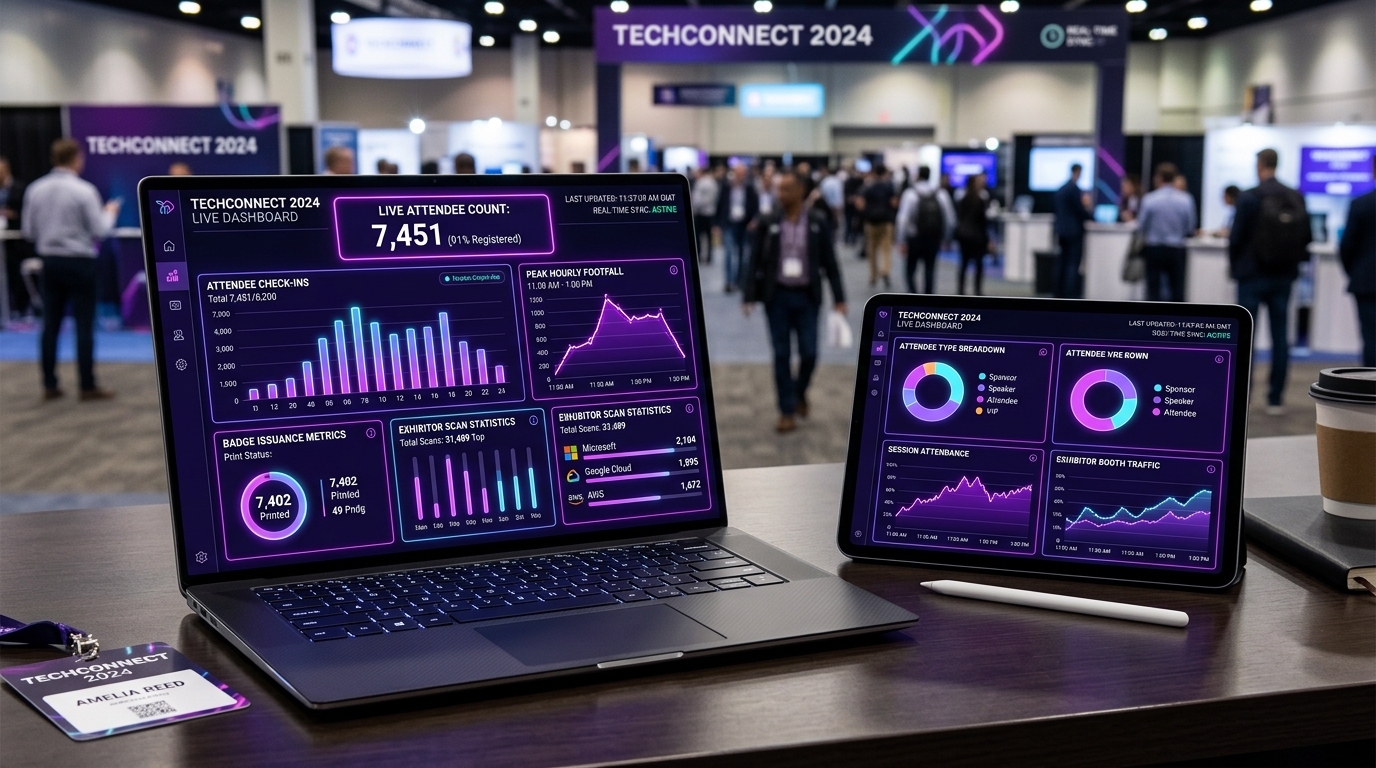
Make data-backed decisions during your event and present verified post-show numbers to stakeholders and sponsors.
Real-time telemetry showing delegates checked in per minute, counter queue wait times, and spot registration revenue.
Live floor plan visualizations highlighting crowded aisles, session room headcounts, and fire code safety thresholds.
Audit exact attendee engagement in keynote presentations and workshop halls with certified entry and exit timestamps.
Generate verified footfall reports proving how many delegates visited specific exhibition stalls and sponsor lounges.
Segment live attendance by delegate category (VIP, Doctor, Exhibitor, Student, Trade Buyer) and geographic origin.
Export your full dataset at any moment into Excel (.xlsx), CSV, and beautifully formatted PDF executive presentation decks.
Sub-second edge processing to executive reporting in 4 reliable steps.
Every optical QR scan, turnstile entry, or RFID gate event is captured locally in under 10 milliseconds.
On-site edge controllers aggregate counter records and eliminate duplicate entries before pushing upstream.
Organizer screens update in real time with active hall headcounts, velocity graphs, and capacity warnings.
Receive comprehensive analytics packages, sponsor ROI reports, and verified attendance certificates within 2 hours.
Schedule a live interactive demonstration of our analytics engine.
Questions regarding mobile dashboard access, update latency, and sponsor reports.
Yes. Our cloud analytics dashboard is fully mobile-responsive, allowing event directors, venue managers, and security leads to monitor live arrival velocity and hall headcounts in real time from any smartphone or tablet.
The dashboard updates within 500 milliseconds of every optical QR scan or RFID gate pass, providing true real-time visibility into lobby traffic and hall capacity.
Yes. Using RFID beacons or exhibitor lead scanner logs, we generate verified footfall reports proving how many delegates visited specific stalls, helping retain sponsors year over year.
Data can be exported with 1-click in Microsoft Excel (.xlsx), CSV, and executive presentation-ready PDF summaries complete with graphs, timestamps, and demographic segmentation.